What is this benchmark for?
The primary motivation behind this benchmark is to compare the runtime of algorithms reported using different GPUs. It is typical to find different GPUs used in different papers or codebases, making a fair comparison of their reported runtime a challenging task. Fortunately, we observe that the runtime of most algorithms remains approximately inversely proportional to the performance of the GPU. Therefore, we can use this benchmark to estimate the runtime of an algorithm running on a different GPU. Taking V100 and RTX 3090 as the example GPU pairs, we derive the performance ratio in this benchmark based on the latency measurements of Faster R-CNN (ResNet-50 backboned): 39.72/31.01 ≈ 1.281 (complex tasks, inference). Next, we can estimate the runtime of a similar task on V100 or RTX 3090, given the measurement on either GPUs. For example, given Mask R-CNN (Swin Transformer backboned) measuring 62.76 ms on V100, we estimate its runtime on RTX 3090 to be 62.76/1.281 ≈ 48.99 ms, which is very close to the actual measurement of 48.47 ms. This benchmark adopts a latency-based metric and may be relevant to people developing or deploying real-time algorithms.
This benchmark can also be used as a GPU purchasing guide when you build your next deep learning rig. From this perspective, this benchmark aims to isolate GPU processing speed from the memory capacity, in the sense that how fast your CPU is should not depend on how much memory you install in your machine. Hardware specs such as GPU microarchitecture, clock rate, memory bandwidth, and the number of CUDA cores will play prominent roles in this benchmark. Note that we are not claiming that memory is not important. It's just that the memory capacity is something you can look up easily through the spec sheet.
How is this benchmark different from existing ones?
Most existing GPU benchmarks for deep learning are throughput-based (throughput chosen as the primary metric) [1,2]. However, throughput measures not only the performance of the GPU, but also the whole system, and such a metric may not accurately reflect the performance of the GPU. For example, the recent FFCV framework claims to achieve several times training speedup over standard PyTorch training and even NVIDIA's DALI simply by designing a better data loader [4]. Therefore, whether using an optimized data loader or not may greatly influence the GPU benchmark results. Some codebases define the throughput based on the GPU compute time and thus circumvent the above issue. But in order to maximize throughput, variable batch sizes are used for different GPUs to fill up all available GPU memory. We point out that maximizing the batch size is not always possible in practice. During training, increasing the batch size may lead to accuracy drops [5]. People have proposed several heuristics, such as the linear scaling rule [6], to address this issue, but these heuristics either are too complicated or not versatile enough for all the models. Consequently, one cannot alter the batch size freely if one wishes to maintain the original accuracy of the model. During inference, the batch size is entirely possible to be limited to just one. For example, an online or interactive setting might force the model to process only one example at a time before waiting for the next example to arrive. For people familiar with CPU benchmarks, the setting of maxing out batch size vs. fixing the batch size for GPUs is analogous to the setting of multi-core vs. single-thread benchmarking for CPUs --- while it is great to have over a dozen CPU cores, not all applications can make efficient use of all these cores. By adopting a fixed data size across all GPUs, we isolate the GPU processing speed from the memory capacity. Another latency-based GPU benchmark also exists [7], but it only has TensorFlow benchmarks and includes only pre-Ampere (old) GPUs. That being said, these existing benchmarks are still useful depending on your application, and our benchmark is designed to complement them with an alternative perspective.
How is the performance measured?
Latency measurement
We measure the model latency under two settings and for two tasks:
- Inference: we measure the latency of a forward pass, including postprocessing, but not preprocessing, which is typically done on CPUs.
- Training: we measure the latency of a forward pass and a backward pass, including loss computation and parameter updates. Similarly, we don't include any data preprocessing time.
- Simple tasks: we choose ImageNet classification with ResNet-50 as the representative simple task [8]. The model uses only standard operations, there are no postprocessing steps, and all tensors remain fixed sizes throughout the network.
- Complex tasks: we choose MS COCO object detection with Faster R-CNN (FPN) to be the representative complex task [9,10]. The model uses non-standard operations like RoIAlign and non-maximum suppression (NMS). The tensor size varies depending on the outcome of NMS in the first stage.
Batch size: For ImageNet classification, we use the default batch size for both training and inference, which is 64 per GPU. We have also tried (in version 1.0) to use batch size 1 but found such a small workload tends to produce noisy measurements when other system factors come into play. For MS COCO object detection, we use batch size 1 for inference, which is consistent with the standard evaluation, and use the default batch size 2 per GPU for training.
Performance calculation
After we obtain all the latency measures, we first select one GPU as the baseline, which is V100 in our case, since it has been widely used in many algorithm and hardware benchmarks[11,12]. Next, we divide the latency of the baseline by the latency of each GPU to get the performance scores under each setting. Then we linearly combine the scores based on the weightings:
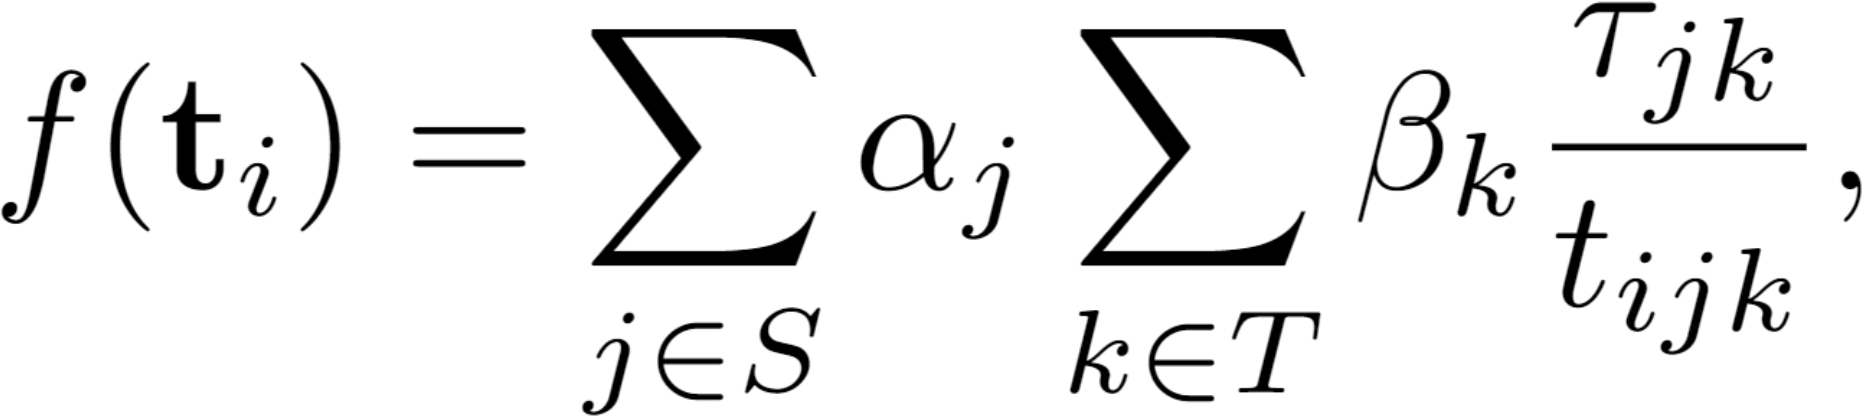
where S, T denote settings and tasks respectively, α and β are the respective weightings, 𝜏 is the baseline timing.
Adjustable weightings: you can drag the sliders above to adjust the weights. One slider controls the weightings for inference and training (α), and the other one controls the weightings between tasks (β). Using a matching set of weightings with your application can help you better estimate the runtime of algorithms across GPUs.
Implementation
We use PyTorch-based implementation for all tasks. Specifically, we use llcv 0.0.9 and mmdetection 2.21.0 for image classification and object detection respectively. We synchronize CUDA kernels before calling the timers. We use a single GPU for both training and inference. By default, we benchmark under CUDA 11.3 and PyTorch 1.10. The performance of TITAN RTX was measured using an old software environment (CUDA 10.0 and PyTorch 1.1) with different datasets (CIFAR-10 [13] and Argoverse-HD [12]). We also measured V100 under the old setting to get a performance ratio between the two.
The code is open-sourced on
 . Also that's where you can find the changelog of this benchmark.
Questions or comments?
Feel free to post them under Github discussions or just shoot me an email.
What about FP16?
It is not yet covered in this benchmark, and we might add it in the future. Community contributions are always welcome! One note is that FP32 training is still relevant today for research where novel (weird) network architectures are being explored. FP16 (or mixed precision) training may be numerically unstable.